- About
- Learn
- Outreach
- Get Involved
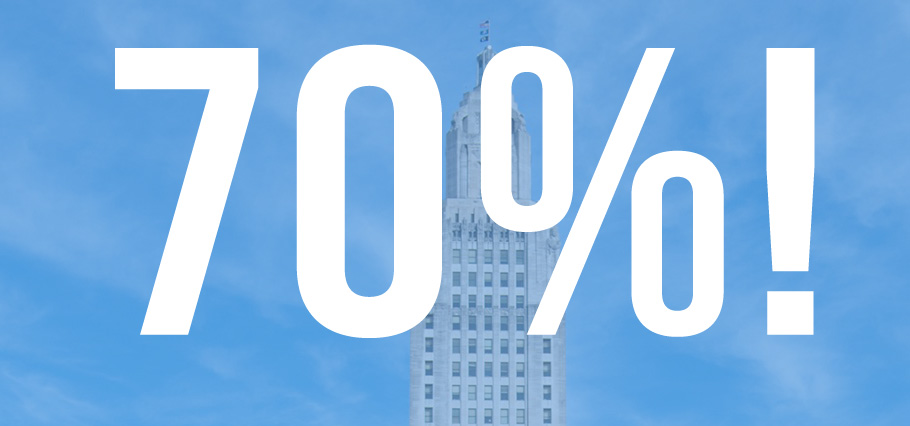
As we knew all along, Louisiana is a pro-life state!
A new poll has found that 70% of Louisiana residents consider themselves to be pro-life, and they do not believe taxpayer funds should be used to provide abortion.
A survey of 1,180 likely 2019 General Election voters was commissioned by Louisiana Right to Life and conducted Feb. 10 and 11 by the Remington Research Group. The sampling was across all demographics.
In Louisiana being pro-life is a non-partisan issue, as shown by overwhelming support in both chambers of the Louisiana Legislature on pro-life votes. In this poll, 87% of Republicans, 58% of Democrats, and 65% identifying as non-partisan identified as pro-life.
Interestingly enough, while 67% of responders who identified as liberals said they were pro-choice, just 40% of those said taxpayer funds should be used to provide abortion services.
The Remington Research Group is a polling firm that specializes in automated IVR technology. The firm was founded in an effort to provide more reliable and affordable polling for campaigns throughout the country. Remington Research Group surveys have been featured in RealClearPolitics, Newsweek, U.S. News & World Report, the Wall Street Journal and numerous local media throughout the United States.
Benjamin Clapper, Executive Director of Louisiana Right to Life, was not surprised by the poll results.
“In light of New York’s recent decision to permit abortion up until birth, this poll sends a clear message that Louisianians will never tolerate abortion-on-demand,” he said. “With 70% of Louisianians self-identifying as pro-life, it is clear that Louisiana is a pro-life state whose citizens believe that every human life deserves protection from the violence of abortion. We look forward to the day when Roe v. Wade is overturned and Louisiana can take action to secure the rights of the most vulnerable among us, the innocent unborn baby.”
Following is a further breakdown of the poll results:
Question 1:
– By media market: Alexandria, 80% pro-life, 20% pro-choice; Baton Rouge, 67% pro-life, 33% pro-choice; Lafayette, 83% pro-life, 17% pro-choice; Lake Charles, 77% pro-life, 23% pro-choice; Monroe, 75% pro-life, 25% pro-choice; New Orleans, 63% pro-life, 37% pro-choice; and Shreveport, 72% pro-life, 28% pro-choice.
– By Party: Republican, 87% pro-life, 13% pro-choice; Democrat, 58% pro-life, 42% pro-choice; and non-partisan, 65% pro-life, 35% pro-choice.
– By Gender: Female, 68% pro-life, 32% pro-choice; mail, 72% pro-life, 27% pro-choice.
– By Ideology: Conservative, 86% pro-life, 14% pro-choice; Moderate, 59% pro-life, 41% pro-choice; Liberal, 33% pro-life, 67% pro-choice.
– By Race: White, 76% pro-life, 24% pro-choice; African-American, 56% pro-life, 44% pro-choice; Other, 66% pro-life, 34% pro-choice; other 56% pro-life, 44% pro-choice.
Question 2:
– By media market: Alexandria, 11% yes, 81% no, 8% not sure; Baton Rouge, 19% yes, 68% no, 13% not sure; Lafayette, 18% yes, 73% no, 10% not sure; Lake Charles, 13% yes, 84% no, 3% not sure; Monroe, 14% no, 77% yes, 9% not sure; New Orleans, 24% yes, 65% no, and 11% not sure; and Shreveport, 8% yes, 79% no, and 12% not sure.
– By Party: Republican, 9% yes, 84% no, 7% not sure; Democrat, 25% yes, 62% no, 13% not sure; Non-Partisan, 21% yes, 66% no, 13% not sure.
– By Gender: Female, 18% yes, 69% no, 13% not sure; Male, 18% yes, 74% no, 8% not sure.
– By Ideology: Conservative, 10% yes, 82% no, 9% not sure; Moderate, 23% yes, 65% no, 13% not sure; Liberal, 40% yes, 45% no, 15% not sure.
– By Race: White, 15% yes, 76% no, 8% not sure; African American, 23% yes, 58% no, 18% not sure; Other, 18% yes, 72% no, 10% not sure; Other, 27% yes, 61% no, 11% not sure.